


%20-%20Stephanie%20(normal).png)


If you’re looking for software to help you build a real-time Stripe dashboard, we’re here to inform your choice! Just keep reading.
We’ll review in this article the best solutions to access your data in a structured way so that you can track which customers have not paid their invoices, identify which customers are most likely to churn, or how much revenue comes from different customer channels. We’ll help inform your choice between ProfitWell, Baremetrics, ChartMogul, Woopra, SaaSoptics and Stripe Sigma (+ a little bonus).
SaaS Metrics
At first, when your SaaS business just started out, you might have wanted to track a few SaaS metrics built with your Stripe data in a dashboard. We’re talking here of MRR, Churn, LTV, ARPU, ARR, etc. Oh, and by the way, please let me congratulate you if you were savvy to have even think of tracking these metrics at all!
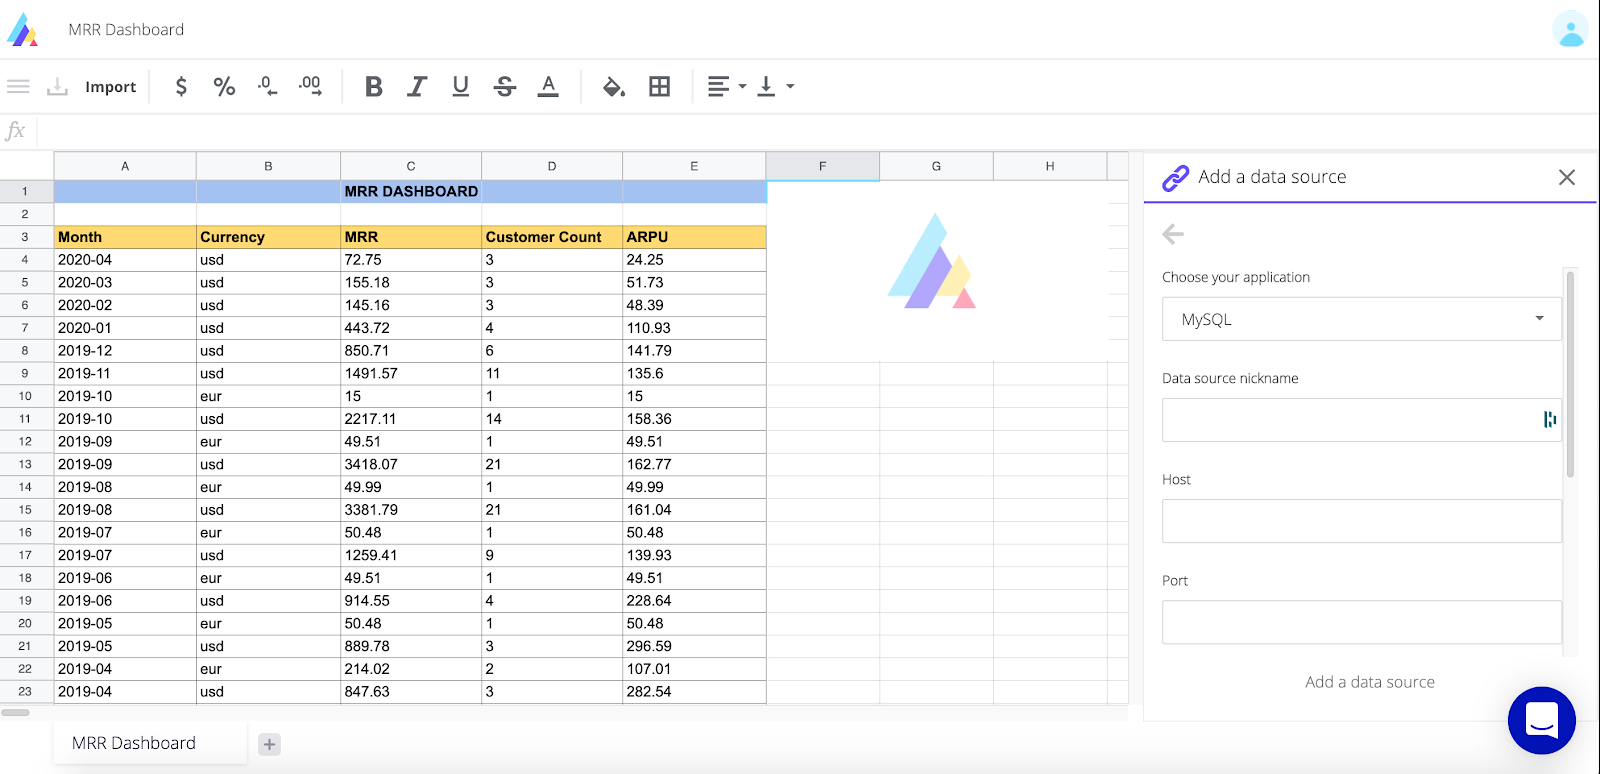
Homemade Stripe Dashboard on a Spreadsheet
So here, your first move has most likely been to start using Google Sheets or Excel, right? Smart choice since you knew your way around spreadsheets and they provide a great deal of customization and flexibility. But, as your company scaled (🙌), this dashboard covered only your most basic needs and it started to take too much time to compile. It’s a lot of work to keep your dashboard up-to-date, fetching the data from Stripe. We bet CSV exports are a serious pain for you, and homegrown tools are more prone to human error. Well, what can you do now that you outgrow your homemade Stripe dashboard?
Subscription Analytics and Insights Solutions Integrated With Stripe
But even though you know some automations could save you some time, you fear that trying to automate your homemade spreadsheet dashboards with Zapier or Google Sheets Add-ons might get the whole thing clunky. And you’d also rather avoid solutions that require to write complex SQL queries.
When comes the time, subscription analytics solutions are great to help your SaaS software company track the efficiency of your model. They will automate your analysis of everything from ARPU to churn, assist your finance team to close the books faster and provide insights about new business opportunities.
Top Solutions Reviewed (+ a bonus)
ProfitWell
How it looks

Pros and Cons
ProfitWell claims to be “the best SaaS metrics on the market” and it seems that their ratings confirm it. They get a striking 4.9 out of 121 reviews on g2.com!🏅 But now, the most surprising thing of all: their SaaS analytics platform for Stripe is free. Yes, free. For unlimited users. Sound too good to be true? The rationale behind it is that free offering helps bring individuals through the door, lowering their customer acquisition costs. Then, their product shows you where cash is leaking from your business and helps them upsell you on their other tools to recover that cash. Fair enough. Besides, we guess that getting data from 14k companies gives them invaluable access to industry metrics they use to build their pricing expertise (that you might be willing to pay for down the road).They claim its takes 2 minutes to set up your account, and it’s true, but you’ll still need to be patient since it takes 2-3 hours to import your Stripe data, so you won’t actually see your first dashboard right away. Regarding the reporting, we bet you’ve been through hell to get accurate info. A great thing here is that they took care of the edge cases that might have driven you crazy: multiple time zones, currencies, discounts… Maybe the only real downside here is that you start with a free software now but might end up subscribing to their other softwares and it could be expensive. Whatever your decision, you should absolutely bookmark their resources since they share tons of extremely valuable articles and videos on its blog and youtube accounts.
Overall rating
4.9 stars on g2.com (121 reviews)
Pricing/Free Trial
Free Trial: The product is actually entirely free forever.
Retain: based on revenue recovered ($0 if $0 recovered)
Recognized: $1,000 / month
Price Intelligently: ask a quote
Baremetrics
How it looks

Pros and Cons
You get hundreds of valuable metrics and business insights in very clear and elegant dashboards by just connecting your data source to the platform. You save precious time by getting your SaaS metrics calculated in real-time with your Stripe data in a dashboard: MRR, Churn, LTV, ARPU, ARR, etc. Just keep in mind that you won’t be able to customize your metrics. You need to double check that their metrics definitions suit your business model since you can’t modify them.
We’ve been impressed at how easy it is to connect our Stripe data to the platform: we’ve first clicked on a button to connect with Google in order to register, and then on another button to connect to Stripe. A few minutes later, our data was connected and voilà! We had access to dashboards with tons of insightful data. Given how much sweat we spent to get those numbers right from scratch on a spreadsheet, we’ve found it pretty awesome!
Overall rating
4.5 stars on g2.com (11 reviews)
Pricing/Free Trial
Free Trial: Available (14 days)
Custom–tailored pricing depending on your MRR, for example:
- $0 MRR > $50 /month
- $500,000 MRR > $500 /month
ChartMogul
How it looks

A brief intro video to learn more:
https://www.youtube.com/watch?v=XyqtJtxThS4
Pros and Cons
The ChartMogul solution is very clear and rich. You’ll find data on pretty much anything you want to dig in. We like the fact that almost any number is clickable. It means that, each time you want to go further and understand what’s behind a number, you’ll be able to explore it. Compared to other solutions, we feel it helps keep control over the data. Because you can always access the raw data, you don’t get the unpleasant feeling you sometimes have with other analytics that work like a black box. If you’re the kind of person that likes spending time to dig in the data when seeing a trend that is surprising and going back to raw data to see the underlying records, you’ll like this solution. The only downside is that we didn’t think it was as “pretty” as some other analytics. Don’t get us wrong though, it’s nothing ugly, just looks a bit more technical and less fancy, we’d say it’s just a matter of taste.
Overall rating
4.6 stars on g2.com (48 reviews)
Pricing/Free Trial
Free Trial: Available (until less than $10K in MRR)
$100 / month when $10K MRR + $25 / month per additional $10K MRR
From $2,000 / month when +$10M annual run rate
Woopra
How it looks

A brief intro video to learn more:
Pros and Cons
We’d say this tool is mostly a web analytics solution that you should consider if you love to carry out detective work, track a user journey, and easily find data on your individual users. It’s great at stitching together several tools to help you understand the behavior of your user's activity and monitor issues in every step of the process. We believe that seeing your activity from an end-to-end user journey point of view is a holistic approach that can really make a difference. When you walk in your users shoes, you can start building a product that truly answers their needs and create a better customer experience. It’s probably a bit overkill for a small business though. You should first generate lots of user data every week and have a few months of serious data history to benefit from it. Since Woopra has a good free plan, we recommend trying that out first and making sure it's right for you because the paid plans are quite pricey.
Overall rating
4.4 stars on g2.com (154 reviews)
Pricing/Free Trial
Free Trial: Available (30 days)
Core: Free
Pro: $999 / month
Enterprise: Contact them
SaaSoptics
How it looks

Pros and Cons
SaaSoptics is more for accounting purposes since it’s a solid solution for subscription management and revenue recognition that integrates very nicely with Quickbooks, Salesforce and Stripe. So if you work with those, you should definitely have a look at it. Their customer support team also does a great job at assisting users. The UI isn’t very intuitive, which makes the onboarding difficult. It takes time to get used to the product. You’ll have to put in some work at the beginning, there’s quite a learning curve before you can wrap your head around it.
Overall rating
4.6 stars on g2.com (90 reviews)
Pricing/Free Trial
Free Trial: NOT available
Pricing: Request a quote
Stripe Sigma
How it looks

Pros and Cons
If you’d rather avoid solutions that require to write complex SQL queries, then simply stick to the previous solutions we reviewed in this article. But if you’re knowledgeable in SQL and you usually write some custom query scripts to access your Stripe data, then Stripe Sigma is a pretty cool query editor to create more powerful and customizable reports for your business. This reporting interface doesn't give you access to any new data, it's an SQL wrapper on top of their API. With a very pretty UI we must say. You don’t need to set up a DB server, maintain it, and keep feeding transaction data from Stripe into it. While this may not be terribly complex, you always want to save precious development time. Your technical team shouldn’t have to waste time writing scripts and piping data. They need to focus on the core of your product.
Depending on your business model, you might find it quite expensive. First, you’ll have to pay $10 monthly outright even with no charges, and on top of this, the pricing being per-charge makes it far more expensive for businesses selling cheaper products ($5 subscriptions vs. $100 subscriptions). Let’s say you have a $50k MRR for 10k charges with a $5 average charge, other solutions pricing plans (eg. Baremetrics) which scale based on MRR would cost you $100 / month, and Sigma 2.5x that ($253 = $100/month as infrastructure fee + 0.02*500 + 0.018*500 + 0.016*4000 + 0.014*5000). Feels kinda bad but Stripe's fees in general are unfriendly to lower price points anyway. So just do the maths before taking your decision.
Overall rating
We rate it a 4.5.
Pricing/Free Trial
Free Trial: Available
Pricing: based on how many charges, authorizations, and application fees your business processed in the previous month. For instance:
- 0 charges / month : $10 / month
- 1,000 charges / month : $44 / month
- 30,000 charges / month : $533 / month
Bonus: Actiondesk
How it looks
Pros and Cons
What if you’re a spreadsheet power user, couldn’t live without your shortcuts, and you’re so comfortable with spreadsheets that you don't really want to change? You believe that, even if you spend time updating your homegrown dashboards instead of using an automated solution, it helps you get your head into the numbers. And you actually like it. Not the kind of thing you’d say on a first date to look cool but, hey, WE totally get it!
Besides, the biggest pitfall of the softwares we presented in this article is that they’re blackboxes that aren’t easy (or impossible) to modify. Calculations of SaaS metrics are a bit complex and there's no one standard way of calculating MRR, Churn, etc. Each of these softwares have their own definition, leading to different results. Depending on your exact business model or what you want to see, these definitions might not work for you (do you include coupons, taxes, etc). So if you fear those solutions are too buggy to trust with your most important financial metrics and you’re comfortable with spreadsheets, you might want to keep it that way and try Actiondesk. It works like a spreadsheet with an additional superpower: it imports and refreshes data automatically.
Overall rating
4.8 stars on producthunt.com (1,813 reviews)
Ok, we might be a little biased here 😉 But you can discover it for yourself and let us know if you agree:
7 other solutions you might want to have a look at
Supermetrics
https://stripe.com/partners/supermetrics

Zapier
https://stripe.com/partners/zapier

Chargebee
https://stripe.com/partners/chargebee

Zoho Analytics
https://stripe.com/partners/zoho-analytics

Putler
https://stripe.com/partners/putler

Grow
https://stripe.com/partners/grow

Databox
https://stripe.com/partners/databox

In Closing
Whatever the solution you end up choosing, having your business data at your fingertips will help you run your company more efficiently. Your finance team will be able to reconcile charges with your latest bank payout, your data team will understand why your customers dispute payments, your business team will be able to track which customers have not paid their invoices, and your product management will identify how much revenue comes from your different customer channels.
Regardless, metrics aren't that meaningful all by themselves. They're simply numbers. So don’t get too focused on their daily value but rather on the general trends. Discussing with your users and identifying trends are what will help you forecast how successful your business will become!

%20-%20Jonathan%20(normal).jpeg)

